
Ten years ago, a simple idea emerged from the frustration of manually parsing through countless bioinformatics tool outputs: what if we could automatically aggregate and visualize QC metrics from multiple tools and multiple samples in a single, interactive report? That idea became MultiQC, and today we're celebrating a decade of transforming bioinformatics worldwide.
A Decade of Impact by Numbers
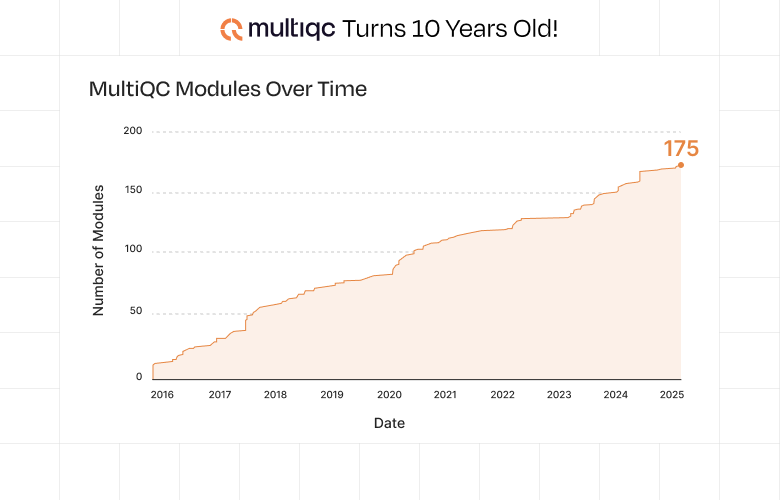
The growth of MultiQC over the past 10 years has been nothing short of remarkable. What started as a simple project for one lab now supports nearly 170 different bioinformatics tools and is run once every 3 seconds1 and gets over 8-9 journal citations every day.2
Importance of Being Open
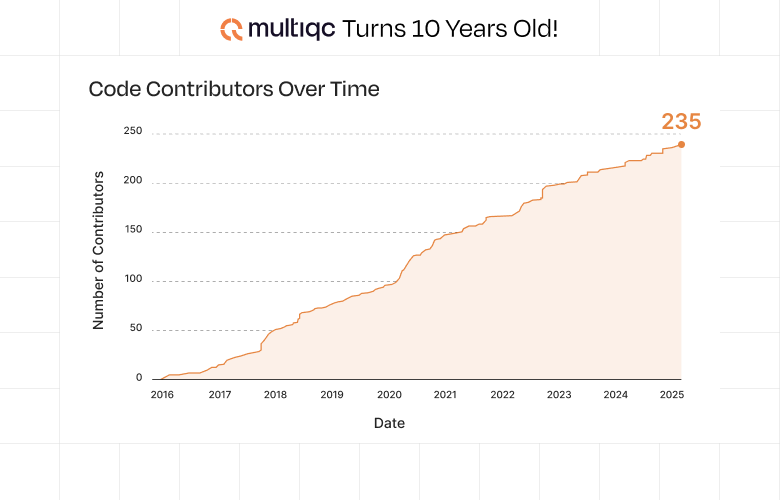
As with Nextflow, one of the greatest strengths of MultiQC has been its commitment to open source development. What started as a one-person project in 2015 has grown into a collaborative effort involving 235 contributors in 2025. This growth represents the true spirit of open science - where researchers from around the world contribute their expertise to build something greater than any individual could create alone.
This collaborative approach has been crucial to MultiQC's success, enabling support for an ever-expanding ecosystem of bioinformatics tools and ensuring the software meets the diverse needs of the global research community.
A Timeline of Innovation
MultiQC's journey over the past decade has been marked by continuous innovation and adaptation to the evolving needs of bioinformatics researchers.
The Foundation Years (2015-2016)
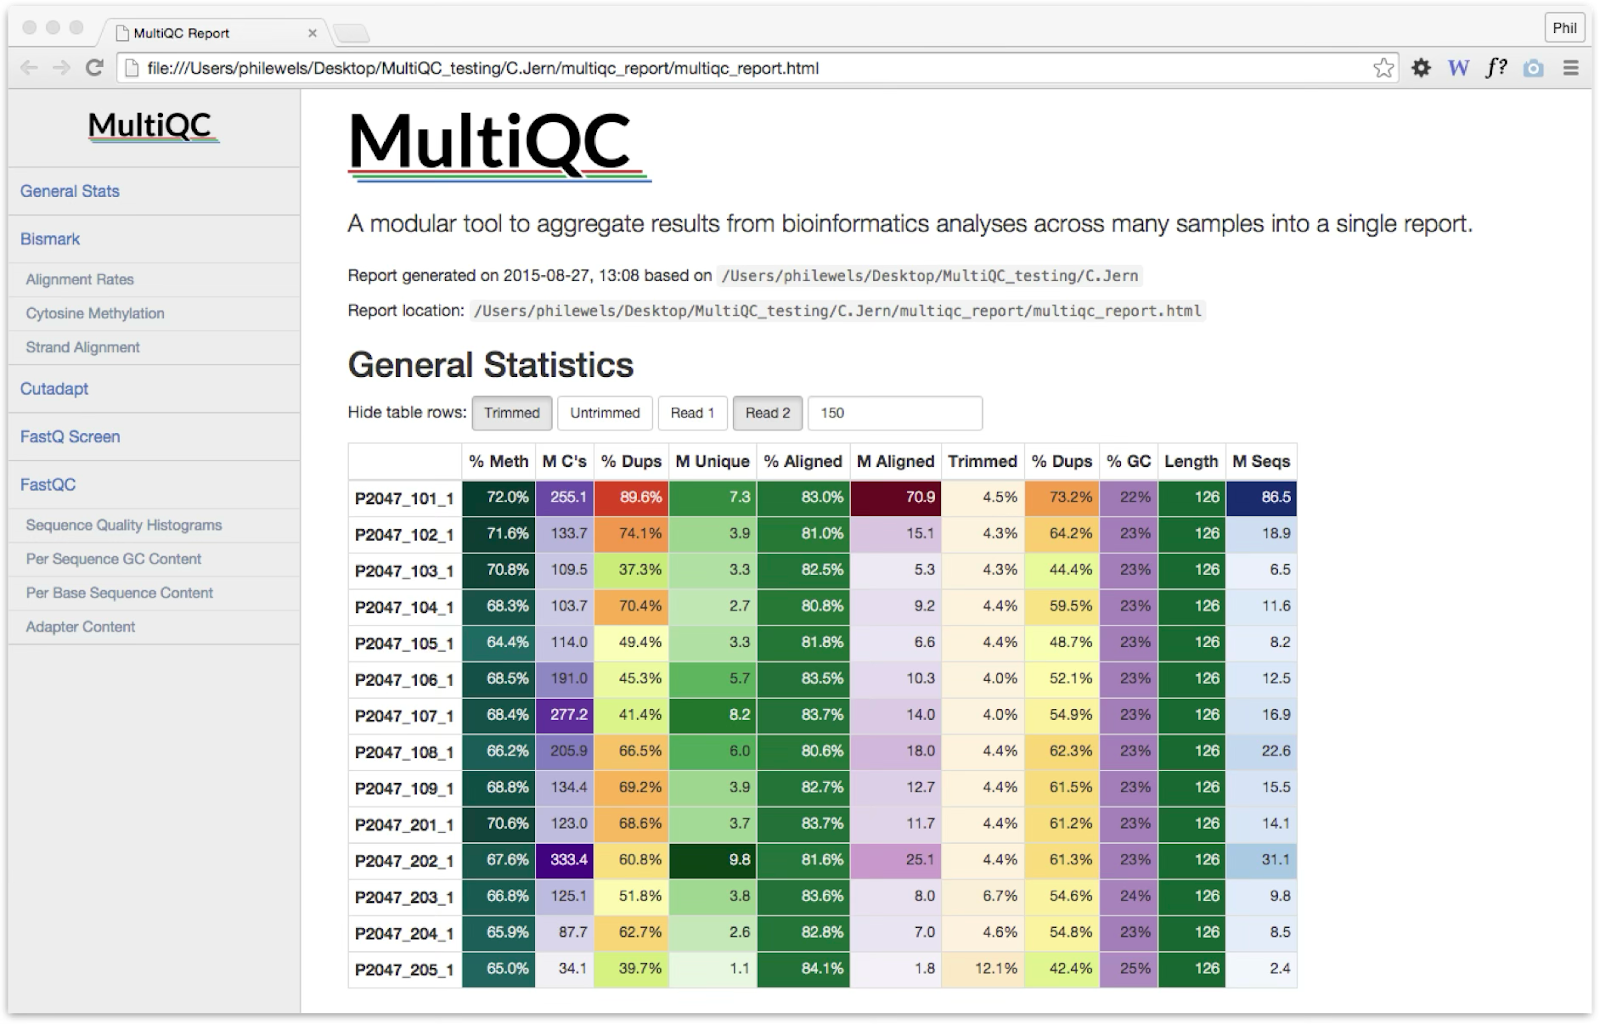
Very few tools come out of nowhere, and MultiQC was no exception. I had a split background of web development as a hobby and bioinformatician as a day job. Visualization of data was an obvious route and projects as far as back as 2012 I was writing Perl scripts to create HTML summary reports from bioinformatics tools (one for Bismark wound up being pulled into bismark2report, another ended up in HiCUP, others for bowtie and tophat were lost to the mists of time). When joining SciLifeLab NGI there was an obvious need for similar visualizations and more one-off scripts flourished. The closest to what we’d now recognise as MultiQC was a planned module for the internal LIMS “genomics-status”. This had an overview table of key statistics and a way to quickly key through FastQC plots for each sample.
Whilst I liked the direction that the proof-of-concept was going in, I felt frustrated that I kept writing new projects for every new tool I wanted to visualise. I sat down to try to solve this once and for all with a tool that could provide the base functionality for generating plots and HTML reports, but with a modular structure that could allow me to slot in new tools as they came along without starting from scratch. And so, MultiQC was born with an initial commit on Friday 4th August 2015. September 2015 marked the first release of MultiQC, supporting 8 different bioinformatics tools and introducing the world to automated bioinformatics quality control reporting.
A flurry of development followed, with multiple releases following which added in much of the core functionality that MultiQC remains to this day. A key step was version 0.5 in March 2016, which introduced duplicate “flat image” plots created with Matplotlib, allowing the tool to evolve to handle big reports supporting hundreds or thousands of samples - a game-changer for large-scale genomics projects. MultiQC gained popularity very quickly after being released. Nothing it did was particularly clever, but it was easy to use and most of the time “just worked”. A series of social media posts propelled it to relative fame, and soon there were issues coming in requesting support for new tools, with pull-requests following not long after. By the time a manuscript was written the tool was already well known and well used, and the paper was accepted for publication in Bioinformatics without revision (the only such one in my career!) in July 2016.
Build Capabilities and Module Growth (2017-2021)
The years that followed brought more measured advances, but new features and modules steadily made their way into the MultiQC codebase.
December 2016 brought the addition of “custom content” support, a new way of processing arbitrary input data that opened new possibilities for researchers to tailor reports to their specific needs. Now if you had a custom analysis script you could shape the output files to match MultiQC’s expectations and it could parse the data and insert into a report without a specific module. What was initially meant to be a small feature to capture one or two edge cases quickly escalated to a core functionality that enabled MultiQC to cover a wider range of data types than ever.
January 2018 brought conditional formatting and highlighting of cell contents in tables, making it easier to spot outliers and important metrics at a glance - a feature that would prove essential for quality control workflows with predefined QC thresholds and criteria.
In addition to new core features such as these, these years brought steady growth in the number of bioinformatics tools that were supported. In 2021 MultiQC crossed the threshold of supporting over 100 different tool outputs, meaning that many – if not most – tools being commonly run by bioinformaticians could be reported on with a single command.
The Modernization Era (2022-2025)
The past few years have been transformative for MultiQC, marked by Seqera's commitment to the project when I joined the team in 2022. Vlad Savelyev was hired to work full-time on the project, and the large backlog of feature requests and technical debt that MultiQC had accumulated was tackled head-on. This period of rapid development has seen MultiQC mature into an even more powerful and user-friendly tool for bioinformaticians and scientists worldwide.
- →February 2022: Print tool DOIs alongside tool outputs to promote citation of upstream tools
- →February 2022: Report customization features gave users unprecedented control over their reports
- →September 2022: A major overhaul of command line help using the rich-click package dramatically improved user experience
- →January 2023: Performance optimizations ensured MultiQC could keep pace with ever-growing project sizes - some improvements delivering 5-7x speed increases in file searches
- →September 2023: Reporting software versions enhanced reproducibility - a critical requirement in modern bioinformatics
- →February 2024: The migration from HighCharts to Plotly modernized visualizations, improved interactivity, and brought significant performance gains to reports
- →February 2024: Violin plots with table toggle provided new ways to explore data distributions, especially valuable for large sample sets
- →May 2024: MultiQC as a Python library revolutionized integration possibilities, enabling custom scripts, dynamic report generation, and use in interactive environments
- →October 2024: Refactoring and static typing with Pydantic models improved code quality and maintainability, plus improved sample grouping UI finally solved the long-standing challenge of handling paired-end data and complex sample structures
- →January 2025: AI Summaries brought artificial intelligence to bioinformatics reporting, offering automated insights and interpretation assistance while maintaining user choice in AI providers
- →May 2025: Ability to run MultiQC on previous outputs allows users to rerun MultiQC and merge reports from multiple runs
- →May 2025: Apache Parquet file support prepared MultiQC for the future of data formats and improved performance with massive datasets
- →October 2025: Dark mode and a major update of front-end dependencies
Looking Forward: The Next Decade
As we celebrate this 10-year milestone, I'm excited about what the future holds. Recent achievements showcase the continued evolution and community impact of MultiQC. The tool now supports nearly 170 different bioinformatics tools - a testament to both the diverse ecosystem it serves and the active contribution from our community. MultiQC has evolved from a collection of scrappy reporting scripts into a cornerstone of modern bioinformatics, and this journey is far from over.
Thank You to the Community
MultiQC's success story is fundamentally a community success story. What began as my solution to a daily frustration has flourished because of the incredible bioinformatics community that embraced, contributed to, and championed the tool. From the early adopters who provided crucial feedback and bug reports, to the 235 contributors who have collectively shaped MultiQC's codebase, to the thousands of researchers who cite MultiQC in their publications - every member of the community has played a vital role. I feel incredibly fortunate that what started as a personal itch to scratch has become something that helps researchers around the world every single day.