
Introduction
Data processing of biological data using computational workflows in the cloud at scale has become widely adopted in biotech and biopharma. Detailed cost reporting of computational projects and workflows is critical to understand and optimize cloud spending across an organization. Amazon Web Services (AWS) is a leading cloud service provider used by many organizations to deploy their computational workloads. AWS offers a large selection of different services such as Elastic Compute Cloud (EC2), Simple Storage Service (S3) and Virtual Private Cloud (VPC) among others, each with their own pricing mechanics. Setting up, managing and understanding detailed cloud costs on AWS for complex projects however often remains a challenge. This blog post provides a step-by-step guide to setting up and understanding resource labels within Seqera Platform and how they can be used to tag AWS infrastructure resources for detailed cost reporting across your workflows and teams.
Understanding resource labels in Seqera and AWS
Resource labels are variables in key=value format (examples: org=seqera, workspace=my_workspace) that can be used to tag resources used in your cloud environments. Please note that resource labels on Seqera also work with Google batch, Azure batch and Kubernetes but this blog post focuses solely on AWS. Resource labels can be added at different points during your setup in Seqera:
- During compute environment (CEs) creation
- When adding pipelines to the launchpad
- During a pipeline launch
- When adding or starting a Studio session
When resource labels are added during CE creation with Batch Forge, the compute environment will propagate the tags to the resources generated by the Forge execution (Amazon Elastic Compute Cloud instances (EC2), Elastic Container Service (ECS), Amazon Virtual Private Cloud (VPC), Amazon FSx / EFS and AWS Data Transfers among others). For a full list of resources in AWS that will be tagged by Batch Forge, see the documentation. At execution time, when the jobs are submitted to Batch, the requests are set up to propagate tags to all the instances and volumes created by the Nextflow head job. In contrast, resource labels added at the pipeline or launch level in Seqera cannot tag EC2 instances (since these might already be running and have a tag) and will only tag ECR, VPC and AWS Data Transfer resources. This means that to accurately track all costs associated with your pipeline runs, resource labels in Seqera MUST be specified during CE creation with Batch forge.
Note: If you are generating your AWS compute environment without Batch Forge, it is your responsibility to make sure tags are attached to the proper computeResources objects before adding it as a CE to Seqera.
Resource labels attached by Seqera Platform are tagging AWS resources but have no information about Nextflow tasks when these resources are provisioned. To be able to accurately track costs at the Nextflow task level, we need to add resource labels via the Nextflow resourceLabels directive. These labels propagate to resources such as Elastic container service (ECS) tasks and Batch jobs, tagging only the jobs themselves. Since these labels are attached at execution time by Nextflow, it does not make a difference whether they are specified in the Nextflow config at the CE level, when adding a pipeline to launchpad or at pipeline launch. However if you always want to consistently apply a set of resourceLabels to your Nextflow tasks, we recommend adding them to the Nextflow config during CE creation under Staging options. For more specific details please refer to the Seqera documentation about resource labels.
Requirements: You will require administrative user privileges to set up and configure resource labels on the AWS side and need to be an admin user on Seqera to add resource labels.
Setting up resource labels in AWS
Before any tag can be activated to be included in cost reporting on the AWS side, it needs to be used at least once. The first step is therefore to determine which resource labels we want to use, create a compute environment with these labels and execute a pipeline run. For this example, we will add the following resource labels to the resource labels field in Seqera during CE creation with Batch forge: org, owner, workspace, uniqueID. Additionally, we will add the following snippet to the nextflow configuration block under Staging options.
The ability to use Nextflow configuration in Compute Environments was added in Platform v24.2. If you are on an older version, you will have to add the resource labels to each pipeline or during pipeline launch.
These are some of the labels we frequently use at Seqera to track costs. To activate these tags for cost tracking in AWS, follow these steps, sign in to the AWS Management Console and open the AWS Billing and Cost Management console:
- In the navigation pane, choose Cost allocation tags.
- Select the tag keys that you want to activate
- Choose Activate
Please note that in general once you have executed a pipeline on AWS with resource labels, it can take up to 24 hours for them to be visible in AWS and to appear in the Cost allocation tags tab. Once you have activated the tags, you can use them in Cost explorer and cost reports to track costs.
Throughout this blog post we will use a fresh compute environment that will only run a single pipeline run of nf-core/scrnaseq (release 2.6.0) to isolate costs and illustrate which resources are tagged when using resource labels. We tag this compute environment with a resource label uniqueid=7a9c4b3d2e1f8a5b6c9d0e2f1a3b4c5d at the CE level and add the process resourceLabels as outlined above to the nextflow.config field of the CE. This allows us to retrieve accurate costs for all services utilized by the compute environment, as well as compute costs associated with EC2 instances at the Nextflow task level. Note that all of the setup we describe below was already done on the AWS account used beforehand and therefore all resource labels were propagated to AWS to tag resources. If you want to follow this example and run nf-core/scrnaseq, please do so after “Create AWS data export with split cost allocation data”.
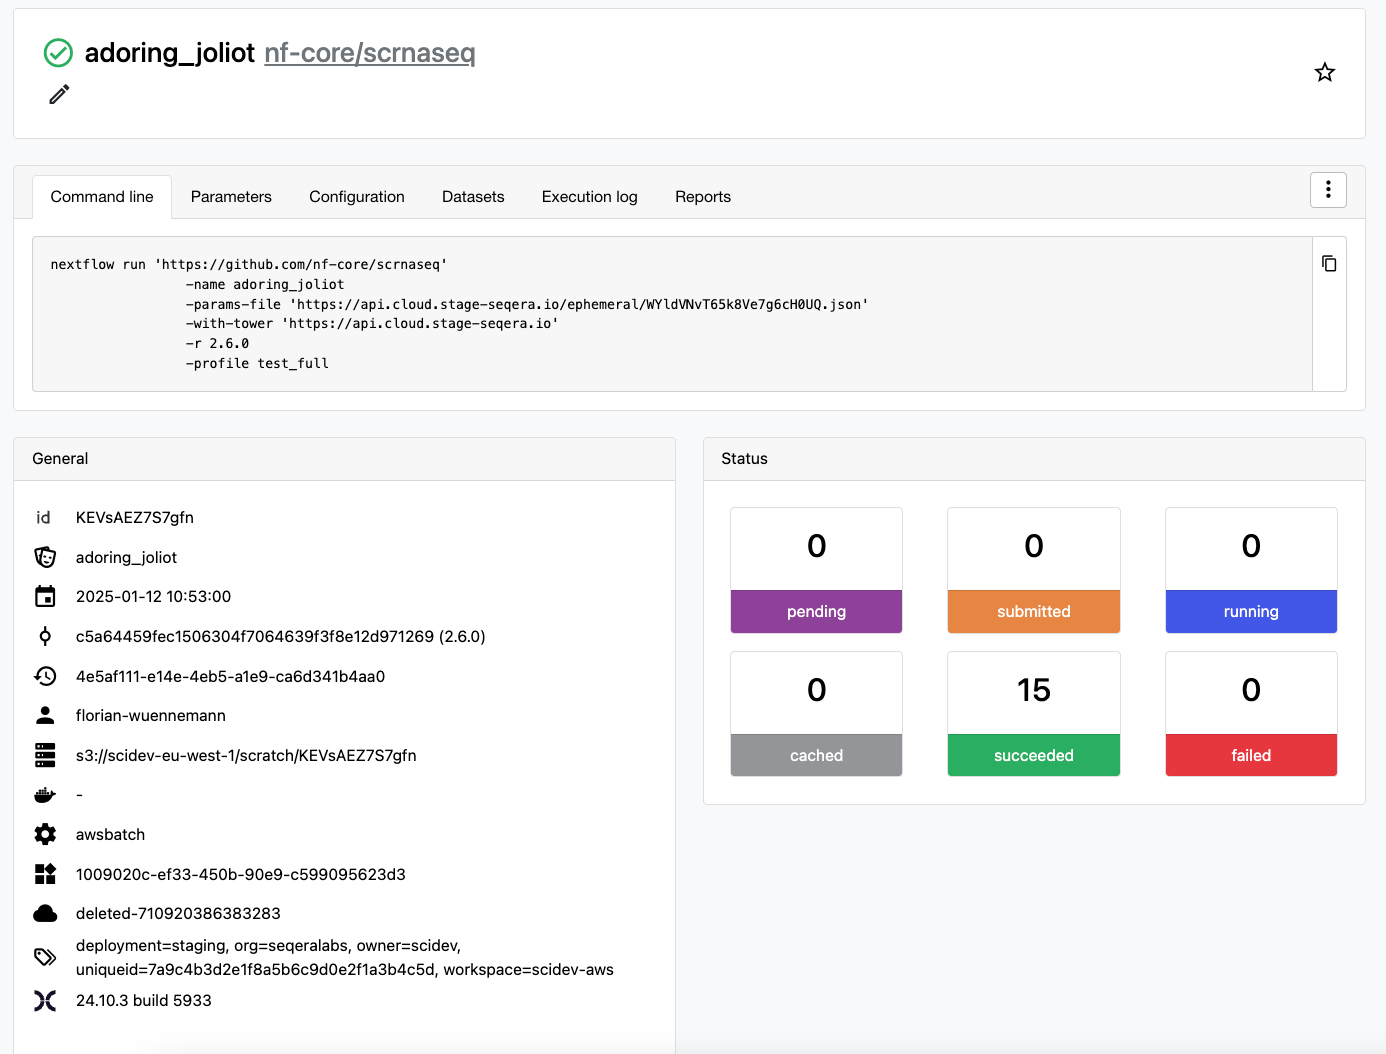
Workflow run page for example run of nf-core/scrnaseq executed in a compute environment tagged with uniqueid=7a9c4b3d2e1f8a5b6c9d0e2f1a3b4c5d.
Using resource labels in AWS Cost Explorer
A simple way to check costs associated with the resource labels we attached to our CE is to use the AWS Cost Explorer. Head to the AWS Billing and Cost Management service → Cost and Usage Analysis → Cost Explorer. This dashboard lets you interactively select which costs you want to look at. First we select the Date Range that we are interested in, select the Granularity we want to see (Monthly, Daily, Hourly) and how we want costs grouped. To see only costs associated with our tagged CE, we go to Tag, select one of the resource labels we have added to the CE (uniqueID for example) and select the value we have specified. This will filter for only services in AWS that have been tagged with the uniqueID resource label and break down cost across these services. While this manual approach can be useful to quickly look up cost distribution across AWS services for a compute environment, it doesn’t allow us to investigate which pipelines and tasks are contributing most to our AWS bill. To do this, we need split cost allocation tagging and data exports.
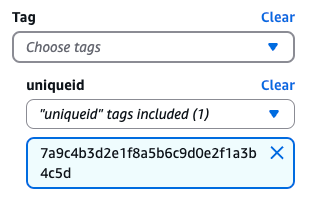
Example of tag “uniqueid” that has been made available in AWS Cost Explorer by tagging a compute environment in Seqera with a resourcelabel uniqueid=7a9c4b3d2e1f8a5b6c9d0e2f1a3b4c5d
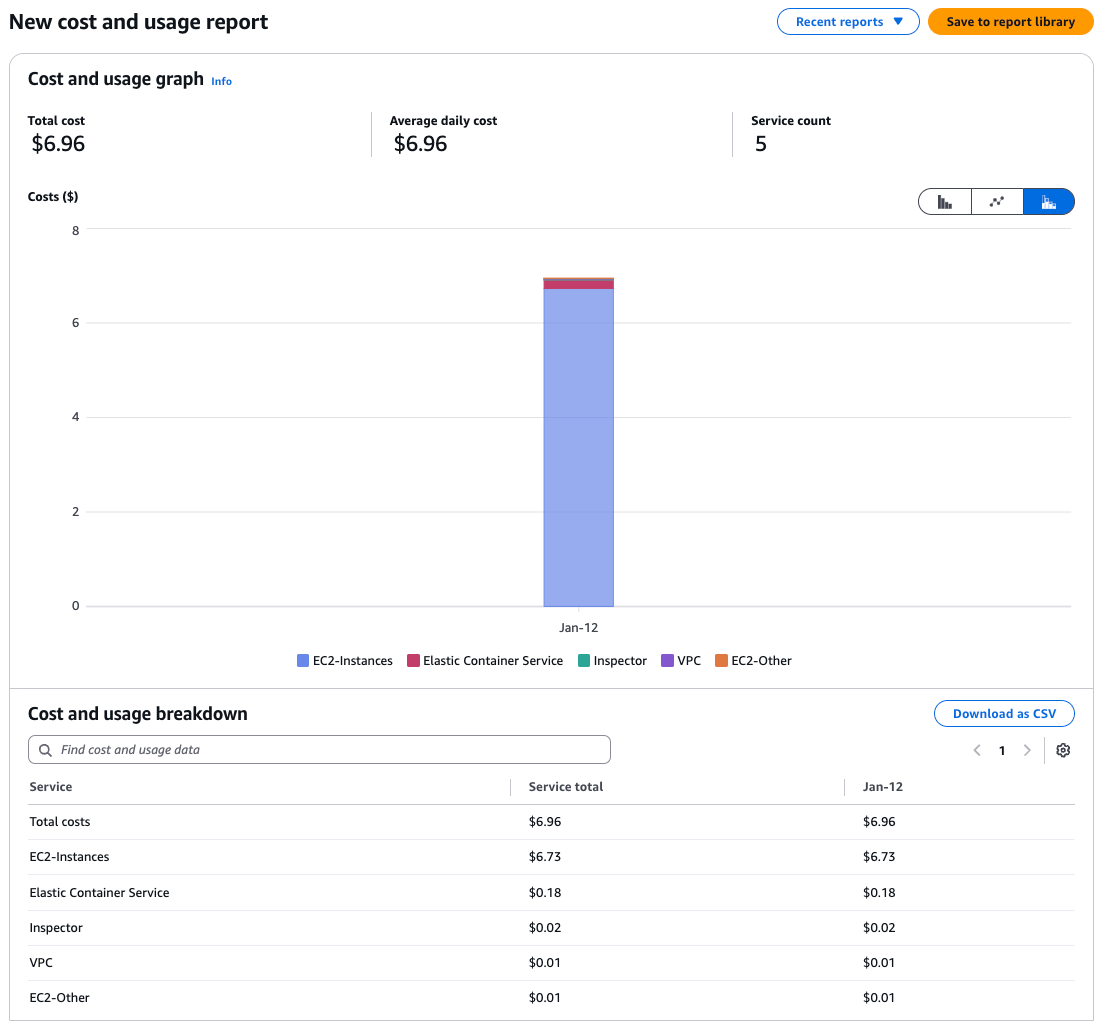
AWS Cost Explorer dashboard for a single pipeline run of nf-core/scnraseq tagged with uniqueid=7a9c4b3d2e1f8a5b6c9d0e2f1a3b4c5d broken down by AWS services.
Enable split cost allocation in AWS
Split cost allocation data allows the distribution of Amazon EC2 instance costs at the Elastic container service (ECS) task level, based on the consumption of vCPU and memory by each ECS task. The granular cost information at the container task level lets you analyze the cost efficiency of tasks from Nextflow workflow executions. To activate split cost allocation in AWS:
- Sign in to the AWS Management Console and open the Billing and Cost Management console.
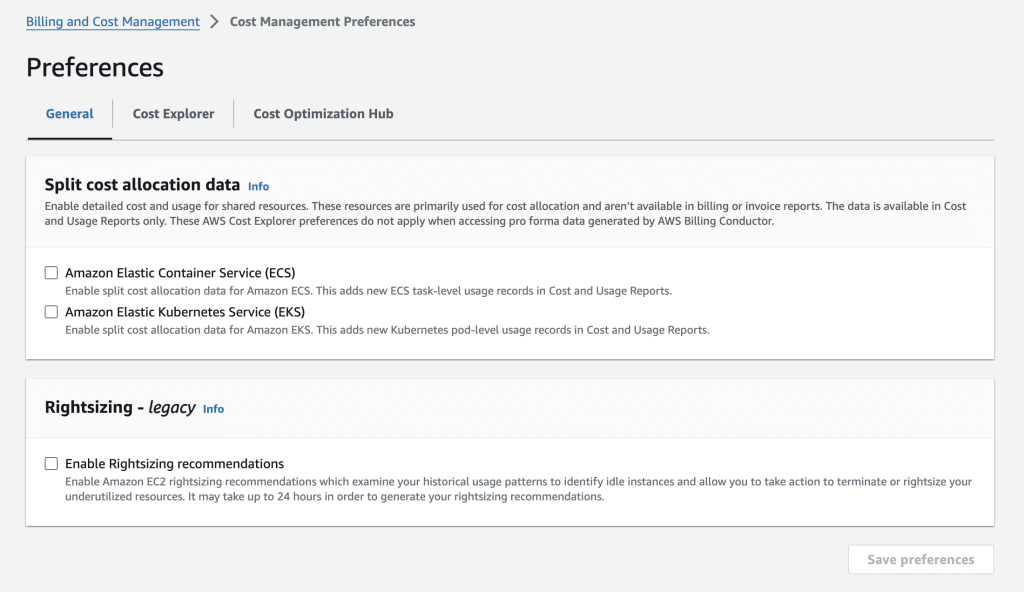
- In the navigation pane, go to the Cost Management Preferences
- Under General, in the Split Cost Allocation Data section, choose the following:
- Amazon Elastic Container Service (Amazon ECS) to opt in to Amazon ECS only. This is required for retrieving costs from your Nextflow workflows executed on AWS Batch.
- Amazon Elastic Kubernetes Service (Amazon EKS) to opt in to Amazon EKS only.
- Click Save preferences.
Hint: Once you’ve opted in, you can choose to have cost and usage data for container-level resources included in Data Exports, formerly known as Cost and Usage Reports (CUR). For detailed instructions, refer to this AWS guide.
Create AWS data export with split cost allocation data
Split cost allocation data introduces new usage records and cost metric columns for each containerized resource ID, such as ECS tasks, into AWS data exports. These split costs are calculated based on the amortized cost of the EC2 instance and the percentage of CPU and memory resources consumed by each container. This approach ensures that costs are allocated precisely according to resource usage, providing a clear and detailed cost breakdown. To include split cost allocation data in your data export reports, follow these steps:
1. Sign in to the Billing and Cost Management console
2. In the navigation pane, choose Data Exports.
3. Click Create to generate a new Data Export/CUR.
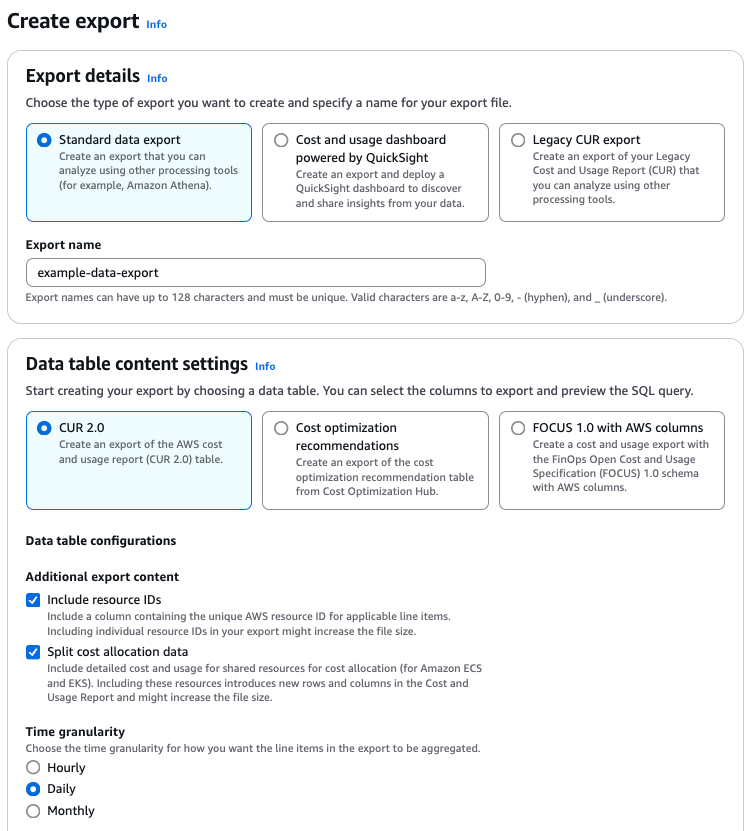
4. Select the Standard data export in Export type.
5. Specify a name for your report.
6. In the Data table content settings section:
- →Select CUR 2.0
- →Under Data table configurations, select Include resource IDs and Split cost allocation data
Note: If using the legacy CUR report, including resource IDs in your export generates individual line items for each resource, which can significantly increase the size of the data export report. However, this provides detailed visibility into the instance IDs used for each ECS task. This enables you to track how many tasks ran on each instance and identify the instance types utilized, offering insights into resource allocation and cost efficiency. We therefore generally recommend enabling this setting.
7. Specify a Time granularity of your choosing
8. In generating the initial report, we recommend you select for all columns under Column selection.
9. In the Data export delivery options section, select Parquet under Compression type and file format
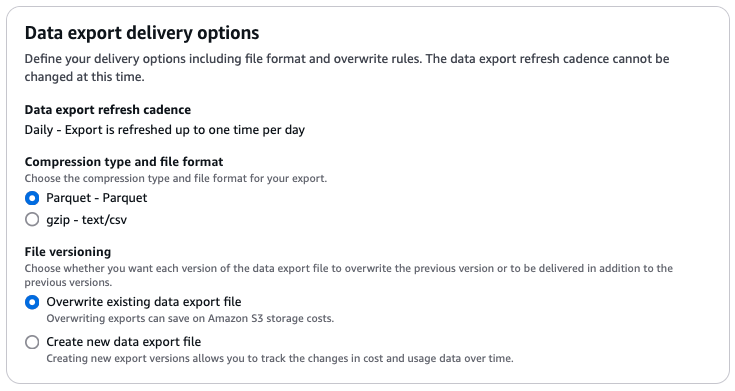
10. Under File versioning, we recommend selecting Overwrite existing data export file to save on S3 storage costs
11. Specify the S3 bucket and optionally, bucket prefix to export your report into under Data export storage settings. You may also click Configure to select an existing bucket or create a new one. It is recommended that you create a new bucket for your exports to avoid contending with any other files or data.
Note: Ensure you have AmazonS3FullAccess and Billing permissions to configure the bucket. Refer to the AWS documentation for detailed setup instructions, and make sure to review the bucket policy applied by AWS.
12. Click Create to generate the data export. AWS will deliver the export to the specified S3 bucket, which may take up to 24 hours for the first report. Keep this timeline in mind if you plan to initiate any pipeline runs whose costs you intend to analyze.
Analyzing costs in AWS data export reports
With AWS tags and split cost allocation data configured, we wait 24 hours after a pipeline run has finished and costs are populated into the data exports. We can download the CUR report from the AWS console under Billing and Cost Management → Data exports → S3 bucket and navigate to the Billing period we want to download and select the corresponding parquet file. Alternatively, you can also download the file using the AWS S3 CLI or directly query it using Amazon Athena (SQL). Once we have downloaded the file, we can perform two different cost analysis on the data:
- Reproduce the results from Cost explorer using CE resource labels with uniqueid
- Calculate compute costs based on Nextflow tasks and identify the most expensive task
In a real world scenario with many pipelines running in a CE, one can of course ask many more questions of this data, but for this simple example, we want to focus on retrieving costs at different levels. Here we will use the popular statistical computing software R to analyze and plot the data. AWS has recently updated their CUR specifications from CUR1.0 to CUR2.0 (https://docs.aws.amazon.com/cur/latest/userguide/table-dictionary-cur2.html), changing the layout of the report file. Here, we provide instructions for both CUR1.0 and CUR2.0 to calculate costs for Nextflow runs with Seqera.
Instructions for processing CUR2.0 report
If you are working with a CUR2.0 report, we will first do some reformatting to turn the resource_tags list column into individual columns (similar to CUR1.0). First, let’s load the parquet file into R using the arrow package. We will also load the tidyverse package for access to packages in the tidyverse such as dplyr and ggplot2.
The following function will take the CUR2.0 report and add resource_tags_* columns to the data frame according to all the unique resource labels defined in the resource_tags column.
We can use this function to convert the CUR2.0 format into CUR1.0:
Instructions for parsing CUR1.0 report
If you are working directly with a CUR1.0 legacy format parquet file, you can read in the file and process without needing to reformat:
We will subset the report for only lines tagged with our uniqueid and subsequently calculate cost by service to reproduce the earlier view from Cost Explorer. In CUR1.0 and after our reformatting of CUR2.0 labels can be found with the prefix resource_tags_user_* in the report. Our uniqueid can therefore be found as resource_tags_user_uniqueid.
As we can see, this reflects the cost per AWS service we were able to see via Cost Explorer with some more precision.
Next, we look at cost split across Nextflow tasks by using the resource label run_id (resource_tags_user_unique_run_id) that we have attached using Nextflow via configuration. For each task, there are two cost lines in the table, one for vCPU and one for memory usage. In addition, split costs are further categorized into used and unused costs,where unused costs represent the cost of unused cpu and memory resources on an instance. For example, if a large instance spins up, multiple tasks finish early but the remaining cpus and memory on the machine can’t be filled with new tasks while the machine finishes the remaining jobs. We therefore have to take the sum of used and unused costs for vCPU and memory to calculate the total compute cost per task. We can then use this aggregated information to plot each tasks’ total cost in descending order.
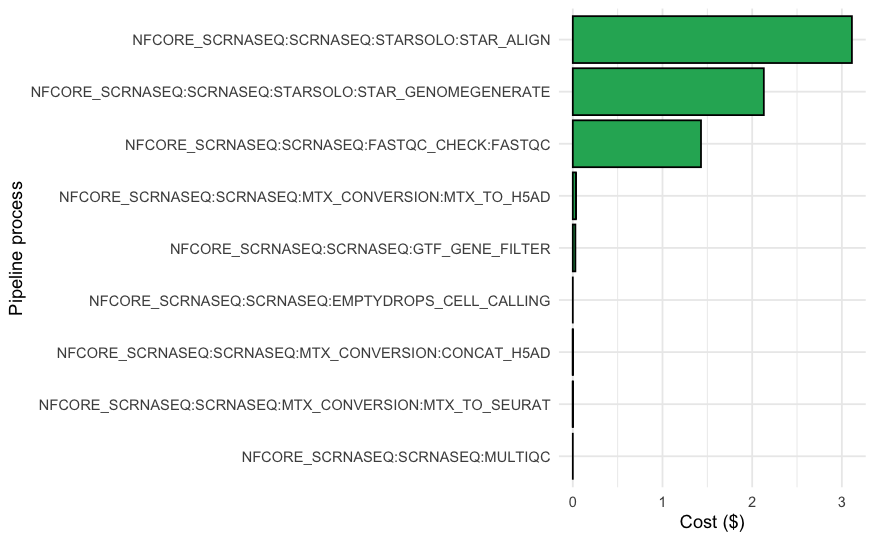
Not surprisingly aligning reads with STAR and generating a genome using STAR carry the highest costs in our example nf-core/scrnaseq run. Given our task-level costing data, we can also calculate the total cost of the pipeline run based on the task compute costs.
We notice that the total cost based on ECS tasks does not match the total ECS cost based on the compute environment resources tagged with a uniqueid, why is that? The resource labels we applied in Seqera at the CE level were able to also tag the container running the Nextflow head job, which is not a task that is tagged by Nextflow. The difference between the uniqueid tagged costs ($6.75) and the Nextflow tagged ECS tasks ($6.73) is therefore the cost of running the Nextflow head job.
Conclusions
Here we covered the different types of resource labels in Seqera, how you can configure and set them up on your AWS account and which resources can be tracked to provide accurate and granular cost reporting. By following this hands-on guide, you can efficiently track and optimize your AWS cloud spending, ensuring your workflows remain both scalable and cost-effective.
If you're ready to get started, head to Seqera and try these steps today!
Additional tip: AWS resource label constraints
AWS imposes some constraints on how resource labels can be defined. Please make sure that your labels comply with the following rules:.
If your tag values do not comply with these constraints, upon running your workflow you might run into errors such as <tagvalue> is not a valid value for TagValue - it contains illegal characters. If you expect that some values in your workflow might not comply with the label limits mentioned above, you can use functions in your Nextflow configuration file to sanitize these values before applying them as tags in AWS. For example:
If your workflow generates a task tag containing spaces (e.g. NA12878, Homo_sapiens_GRCh38), you can add the following snippet to your Nextflow config file:
When you dynamically generate the pipelineTag label, you can call this function to sanitize the value which would return pipelineTag: na12878_homo_sapiens_grch38.