
It’s been an exciting year for the MultiQC team at Seqera, with developments aimed at modernizing the codebase and expanding functionality. In this blog post we’ll recap the big features, such as long-awaited Sample Grouping to simplify report tables, as well as the ability to use MultiQC as a Python library, enabling custom scripts and dynamic report generation. And there’s even more to come – stay tuned for the upcoming MultiQC talk at the Nextflow Summit in Barcelona, excitement guaranteed!
Sample grouping 🫂
Many of you who are used to reading MultiQC reports will be familiar with seeing General Statistics tables that have “gaps” in rows like this:
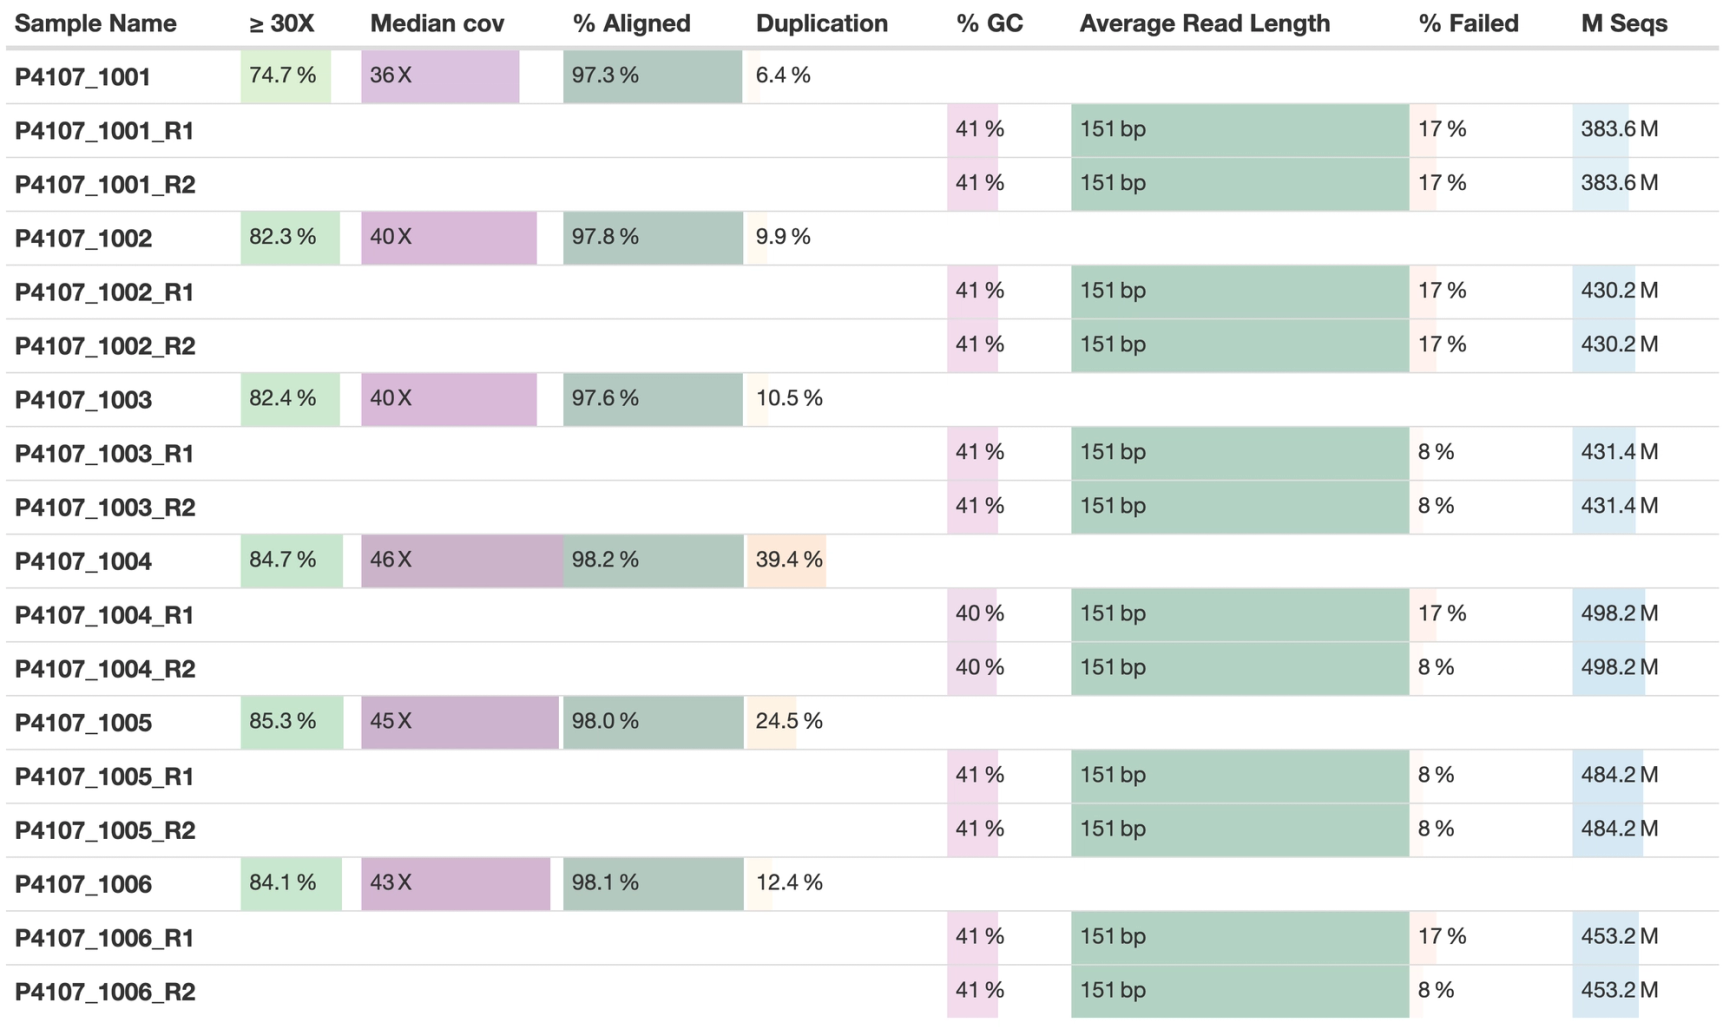
This happens because MultiQC finds sample names from input data filenames. In the case of FastQC, paired-end sequencing data will have two FASTQ files and generate two separate FastQC reports. This means each sample name has a _R1 or _R2 suffix and cannot be merged with outputs from downstream analysis, where these are collapsed into a single sample identifier. Until now, the best advice we’ve been able to give is to either throw half of the data away or put up with the ugly tables - neither are good options!
One of the oldest open issues in the MultiQC repo (#542, from 2017) is about introducing a new technique to group samples. Phil started a branch to work on the problem but hit a wall, leaving the comment “This got really complicated. Need to think about how to improve it.” There it sat, racking up occasional comments and requests for updates.
Finally in MultiQC v1.25, seven years after this issue was created, we’re delighted to introduce – Sample grouping:
This new table_sample_merge config option allows you to specify sample name suffixes to group into a single row (see docs). When set, MultiQC will group samples in supported modules under a common prefix. Any component sample statistics can be shown by toggling the caret in the row header, with summary statistics on the main row. This allows a compressed yet accurate overview of all samples, whilst still allowing readers of the report to dig in and see the underlying data for each input sample.
For now, the new config option is opt-in, but we hope to soon set some common suffixes such as _R1 and _R2 as defaults for all users. Some modules have the concept of sub-samples within parsed data (e.g., flow cells → lanes) and use sample grouping without needing additional configuration. The sample grouping implementation is entirely bespoke to each MultiQC module: each column needs consideration as to whether it should be averaged, summed, or something else. We’ve added support to key modules such as FastQC, Cutadapt, and BCLConvert, and plan to add support to more modules over time.
MultiQC as a library 📜
Version 1.22 brought some major behind-the-scenes refactoring to MultiQC. These changes enable MultiQC to be used as a library within scripts. It adds another way to customize report content beyond “Custom Content” and MultiQC Plugins, as you can now dynamically inject data, filter, and customize report content within a script. Ideal for use within analysis pipelines!
Let's look at a very basic example to give a feel for how this could be used. Here, we have a Python script that imports MultiQC, parses report data from fastp, adds a custom report section and table, and then generates a report.
Scripts like this can be written to do any number of things. We hope it removes the need to run MultiQC multiple times to report on secondary statistics. It can also enable customization of things like table columns, custom data injection, and most other things you can think of! Best of all, unlike MultiQC plugins, no special installation is needed. This will be hugely powerful for custom analysis and reporting. It also means that MultiQC becomes a first-class citizen for explorative analysis within notebooks and analysis apps.
See the new Using MultiQC in interactive environments page to learn more about MultiQC Python functions. Let us know how you get on with this functionality - we’d love to see what you build!
Major performance improvements 🚅
In MultiQC v1.22 we’ve had a number of high-impact pull requests from @rhpvorderman. He did a deep-dive on the compression that MultiQC uses for embedding data within the HTML reports, switching the old lzstring compression for a more up-to-date gzip implementation, which made writing reports 4x times faster.
He also significantly optimized the file search, making it 54% faster on our benchmarks, and key modules. For example, FastQC got 6x faster and uses 10x less memory.
Taken together, comparing a typical v1.22 run against v1.21 shows that MultiQC is 53% faster and has a 6x smaller peak-memory footprint. It’s well worth updating!
To get these numbers for real-world scenarios, we tested some huge input datasets (many thanks to Felix Krueger for helping with these). For example, from Xing et. al. 2020:

These three runs were run with identical inputs and generated essentially identical reports.
These improvements will be especially noticeable with large runs. Improvements are also especially significant in certain MultiQC modules, including FastQC (10x less peak memory), Mosdepth, and Kraken (~20x improvement in memory and CPU in MultiQC v1.24, larger improvements with more samples).
We hope that this makes MultiQC more usable at scale and makes your analysis pipelines run a little smoother!
Unit tests 🧪
Until now, MultiQC only had rudimentary end-to-end testing - each continuous integration test simply runs MultiQC on a range of test data and checks that it doesn’t crash (there are a few more bells and whistles, but that’s the essence of it). These CI tests have worked remarkably well, considering. However - they do not catch unintentional changes to data outputs and are limited in their scope.
Version 1.23 of MultiQC introduced unit tests. These small, isolated tests are a cornerstone of modern software development. A suite of pytest tests now cover most of the core library code. Pytest is also used to “just run” modules as before (with 90% code coverage!), but going forward we will require module authors to include a tests directory with custom detailed unit tests. See Tests for more information.
It’s a lot of work to add useful test coverage to such a large codebase, and anyone familiar with the topic will know that it’s a job that’s never done. However, now that we have a framework and pattern in place we’re hopeful that test coverage will steadily increase and code quality with it.
Refactoring and static typing 📐
MultiQC v1.22 refactoring brings with it the first wave of Pydantic models in the back end. This unlocks run-time validation of plot config attributes - we found and fixed a lot of bugs with this already! The code looks very similar, but the Pydantic models use classes that allow most code IDEs to highlight errors as you write. Validation at run time also means that you catch typos right away, instead of wondering why your configuration is not being applied.

Along similar lines, the core MultiQC library and test suite has had type annotations added throughout, complete with CI testing using mypy. We will progressively add typing to all MultiQC modules over time. Typing also helps the MultiQC developer experience, with rich IDE integrations and earlier bug-catching.
HighCharts removed 🗑
In v1.20 we added support for using Plotly instead of HighCharts for graphs in MultiQC reports. We left the HighCharts code in place whilst we transitioned to the new library, in case people hit any major issues with Plotly. As of v1.22 the HighCharts support (via --template highcharts) has been removed completely. See the MultiQC: A fresh coat of paint blog to find out more about this topic.
Moving to seqera.io
Since MultiQC joined the Seqera family in 2022, we’ve been steadily improving integration with other Seqera tools and websites. Last year, we launched the Seqera Community Forum with a dedicated MultiQC section, which has been a valuable resource for users. Recently, we’ve continued this effort by moving all MultiQC documentation to Seqera.io, providing a single, streamlined location for accessing information and searching across all Seqera tools. Old links will still redirect, ensuring a smooth transition.
We’re also excited to announce that we’re launching a new MultiQC product page at https://seqera.io/multiqc/ with an updated design, which will replace https://multqc.info. This fresh look aligns with the rest of the Seqera ecosystem, making it easier to explore MultiQC’s features and stay up to date with future developments.