
The Seqera blog usually focuses on topics related to Nextflow and Nextflow Tower. While Nextflow gets most of the attention as our flagship open-source project, we thought it was high time to introduce another open-source effort supported by Seqera – MultiQC.
Like Nextflow, MultiQC is a freely available open-source tool with thousands of users and almost 200 contributors. MultiQC was developed by Phil Ewels and colleagues starting in 2015 with support from the National Genomics Infrastructure, part of SciLifeLab in Sweden. With Phil having joined the team Seqera team in March of 2022, Seqera has assumed sponsorship of MultiQC and is committed to supporting this important community effort.
In this article, we briefly explain the challenge of quality control in bioinformatics analysis, introduce MultiQC, and explain why it is such a powerful tool for identifying quality-related issues across samples. We also discuss where MultiQC is best used, its various integrations, and provide information about how to get started. Read on to learn why MultiQC is a must-have tool in any researcher’s toolkit!
Quality control in genomic analysis
We’re all familiar with the adage “garbage in, garbage out” in computer science. This is even more true in genomics! Next-generation DNA sequencing can generate vast amounts of data, and ensuring sample quality is critical to obtaining valid results.
Errors can inevitably arise throughout the sequencing and analysis process. For example, input nucleotide sequences may be degraded or contain contaminants. Adapters added during sample preparation may fail to be washed away. There can be issues with sequencer libraries, reagents, expired chemicals, human error, and even issues with the sequencer itself. Also, read quality naturally degrades with the number of base pairs in a read, making long reads comprising hundreds of base pairs suspect.
Analysts typically assess multiple measures related to yield, quality, error rates, duplication, and alignment to ensure valid results. A common practice is to trim reads with lower-quality scores to improve the quality of analysis. Other tools are used to align reads, deduplicate input data, and count overlaps to correct data before downstream analysis. These quality control steps are often automated and built into pipeline logic.
Multiple Quality Control challenges
Because there are so many potential sources of error, multiple tools are used to identify and resolve quality issues. Tools such as FastQC, Qualimap BamQC, and RSeQC, are used to parse standard file formats (typically variants of BAM, SAM, and FastQ files) and find quality issues in data.
A challenge with existing tools is that they tend to generate reports on a per-sample basis. The information required to properly assess sample quality can reside in dozens or even hundreds of different reports and log files in different formats. This makes it tedious and time-consuming for researchers to gain a holistic view of key quality metrics — especially across multiple samples and tools.
One complication that can be overlooked in large studies is batch effects. These occur when measurements are affected by differences such as laboratory conditions, reagent lots, and even personnel. These differences can be very subtle and difficult to detect when inspecting one sample at a time and can derail analyses, resulting in incorrect conclusions. This makes it essential to conduct comparative quality control across all samples within a single report.
MultiQC
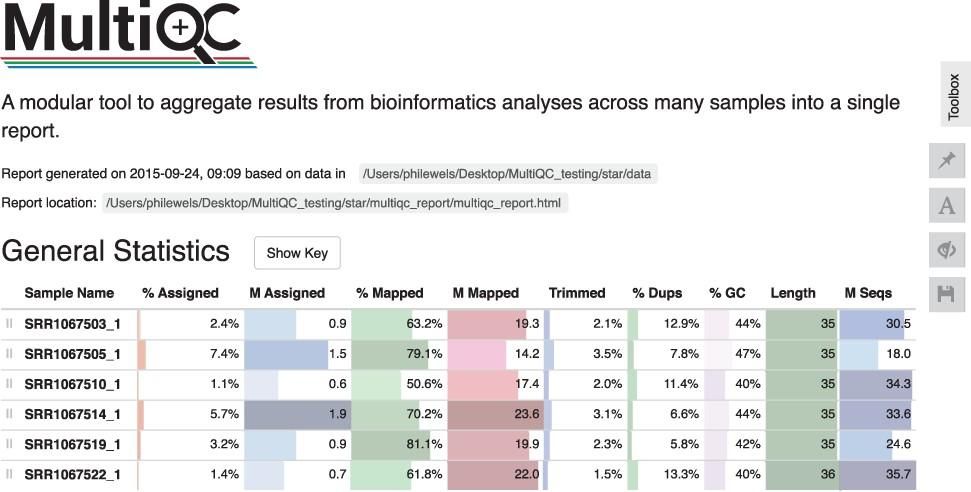
MultiQC addresses these problems by scanning analysis directories for log files and results, creating a single summary report across all samples. MultiQC recognises outputs from most commonly used bioinformatics tools such as QualiMap, SnpEff, GATK, Picard, FastQ Screen, FastQC, Cutadapt, Bismark and more, enabling easy analysis in a single place across samples. Better yet, this functionality is provided “out of the box” without the need to configure MultiQC on a per tool basis. MultiQC is written in such a way that functionality can be easily extended. In fact, at the time of this writing, it supports 128 different bioinformatic tools. Each integration is thoroughly documented.
Collecting data within a single interactive report allows analysts to scan key statistics between samples quickly without switching between multiple files. Sample names are automatically extracted from logged filenames, allowing results from each sample to align across different tools.
Data visualization across samples and the ability to filter data views across samples and detect outliers help combat the risks of batch effects. Reports can be customized and configured to ensure a consistent approach to reporting and analysis across projects. Parsed data is exported in consistent data formats (TSV, YAML, JSON), enabling simplified downstream analysis and visualization. These capabilities can help dramatically simplify the quality control process enabling analysts to be more productive and detect potential data anomalies, leading to higher quality results.
Typical applications
MultiQC can be used in a variety of ways and is ideally suited to being embedded as a final step in multistep analysis pipelines written with Nextflow or other workflow languages. MultiQC is particularly valuable in large projects where ensuring accurate quality control across multiple datasets is critical. Examples of where MultiQC is a particularly good fit include single cell and population studies.
MultiQC is able to parse data for thousands of samples within minutes, adapting report output as required. Parsed data saved by MultiQC can be used for post-processing and dataset filtering. Reports reveal overall analysis success and make it easy to identify abnormal samples.MultiQC is a key tool used in many production-ready nf-core pipelines, including nf-core/hgtseq, nf-core/nascent, nf-core/demultiplex, nf-core/hic, nf-core/sarek, nf-core/methylseq, and more.
While most people use MultiQC for biomedical analysis results, its “Custom Content” parsing allows any arbitrary data to be imported into a report. This feature has seen rapid adoption and led to MultiQC being used in other fields, such as material science and spectrophotometry.
An ideal complement to Nextflow Tower
MultiQC works perfectly well as a component in a Nextflow pipeline, but it is especially powerful when coupled with Nextflow Tower. Just as MultiQC provides an interactive Web UI to visualize data across multiple samples, Tower provides similar capabilities across pipeline runs.
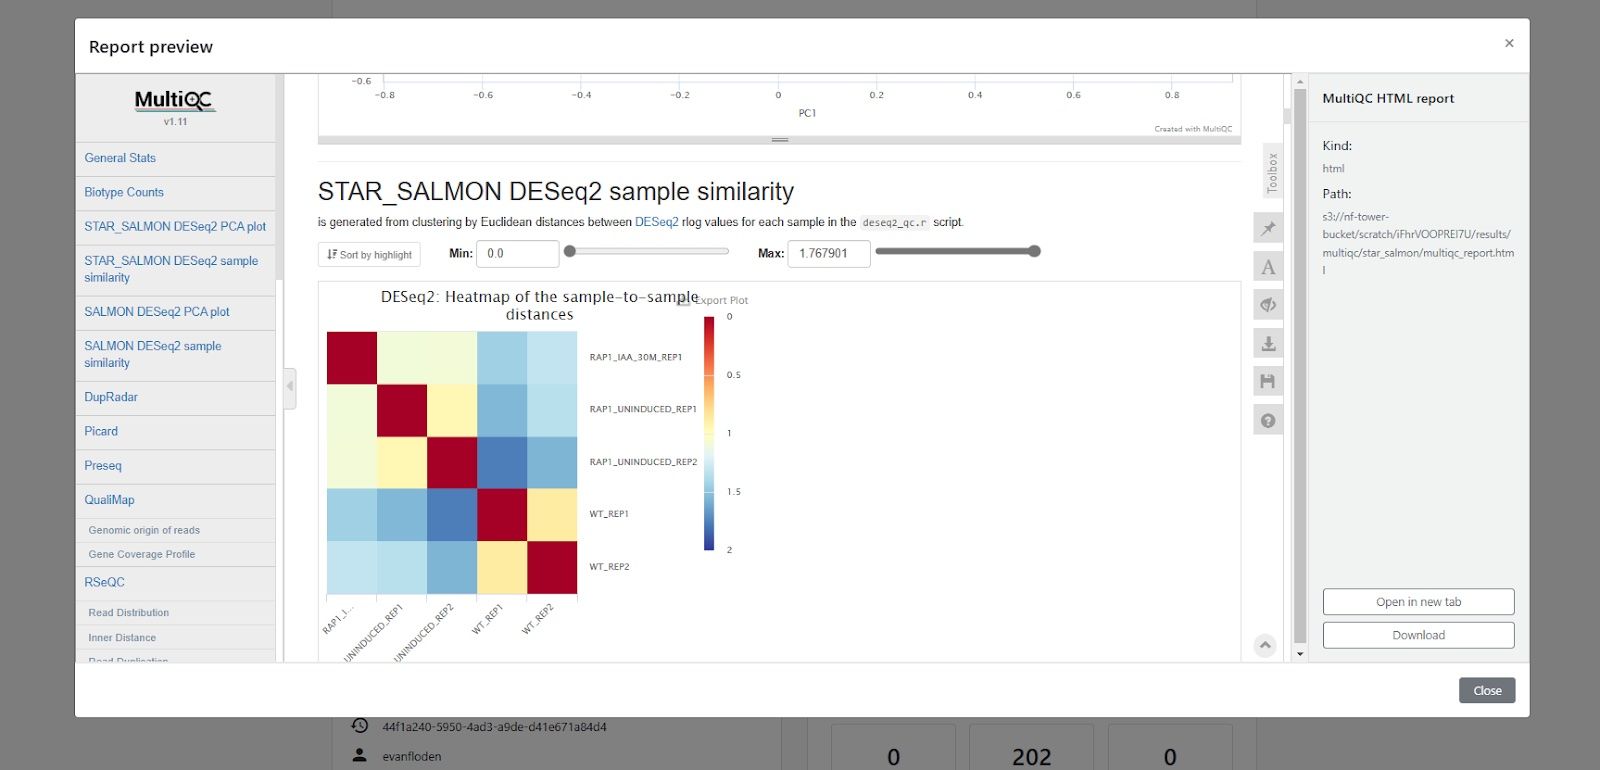
Tower’s built-in reporting functionality enables users collaborating in a shared workspace to easily access interactive reports from MultiQC and other tools directly from the Tower Web UI. Below is an example, showing exploration of a MultiQC report generated by a run of the nf-core/rnaseq pipeline. Using Tower together with MultiQC enables highly effective peer review, enabling colleagues to easily and securely access a wide variety of quality control visualizations.
By organizing runs, and using Tower features such as workspaces, versioned datasets, and labels, researchers can easily search for and have instant access to all runs and reports associated with various projects and biological samples.
Learning more
To learn more about MultiQC and view some interactive reports, visit the project page at MultiQC.info. The short (six minute) MultiQC tutorial video will likely answer most of your questions.
To learn more about Nextflow Tower, and see how you can share MultiQC reports in collaborative workspaces, sign up for the free Tower Cloud community edition and test drive pipelines in the community workspace.